From Hot Spots to Cool Zones: Using Data to Drive Change
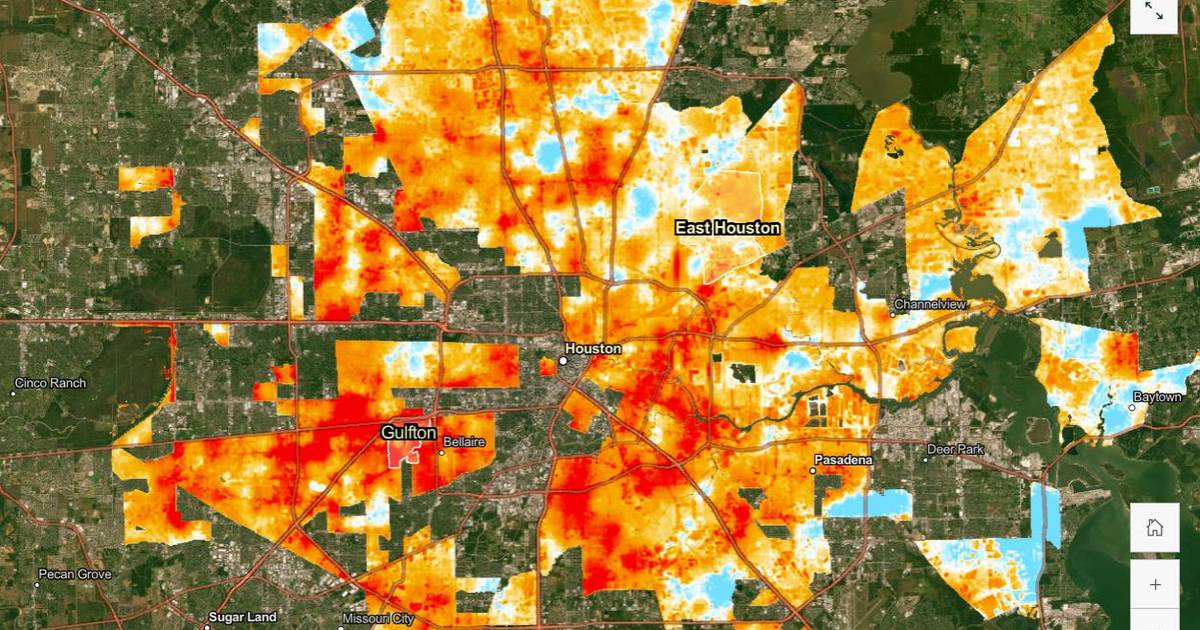
Houston’s 2024 community-led heat mapping campaign collected temperature and humidity data across 69 routes to reveal how urban heat varies by location and time of day. In this NGSS-aligned lesson, students analyze real environmental datasets, investigate the causes of urban heat islands, and evaluate cooling strategies such as green infrastructure and reflective surfaces. Explore more resources and continue your journey in the Investigating Heat Islands pathway.
Related resources
Topics
- urban heat island
- heat mapping
- community science
- environmental data
- GIS mapping
- albedo
- thermal mass
- climate adaptation
- land use
- urban planning
- green infrastructure
- reflective surfaces
- air temperature
- environmental monitoring
- data visualization
- inquiry learning
- climate literacy
- environmental engineering
- temperature analysis
- public health
- urban climate
- heat mitigation
- weather and climate