Interpolation in Line Graphs
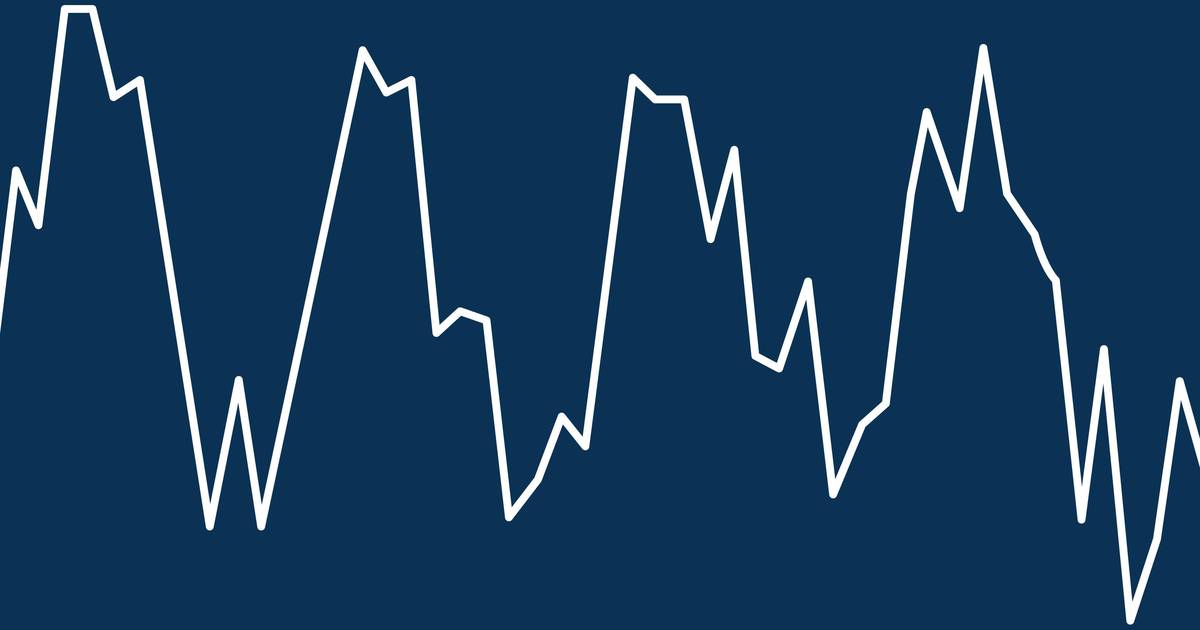
Line graphs use lines to connect data points. The lines interpolate (estimate the intermediate or unknown data points) between known data points. Interpolation can change our overall interpretation of the data, especially if the lines are interpolating between sparse data points. In this interactive widget, try plotting the line graphs for the data resulting from different sampling schedules to see the possible effect of interpolation.
Related resources
Topics
- line graph
- interpolation
- bacterial growth
- sampling rate
- data science