Guide: Osmosis Data Analysis and Interpretation
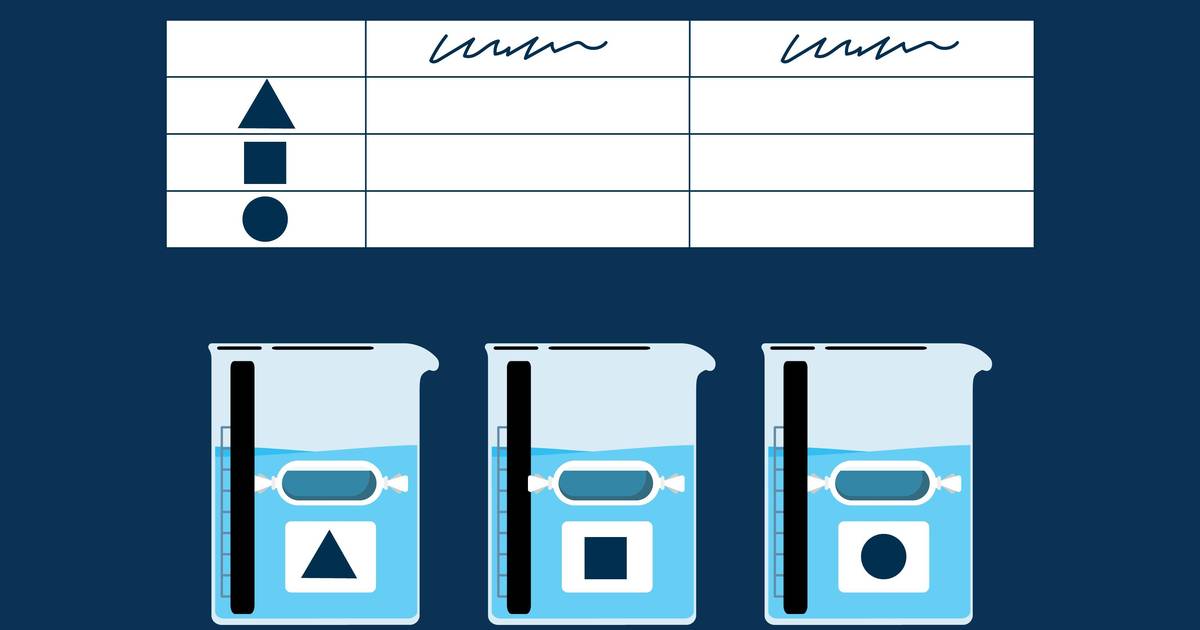
This teaching guide helps educators to integrate the Osmosis Data Analysis and Interpretation simulation into a high school biology lesson. Students build data analysis skills by calculating percent change, creating graphs, and interpreting results from a virtual osmosis experiment.
Topics
- spreadsheet
- fill handle
- formula
- excel
- bar graph
- box plot
- mean
- median
- interquartile range
- iqr
- quartile
- range