Phase Diagrams: Changes in Temperature
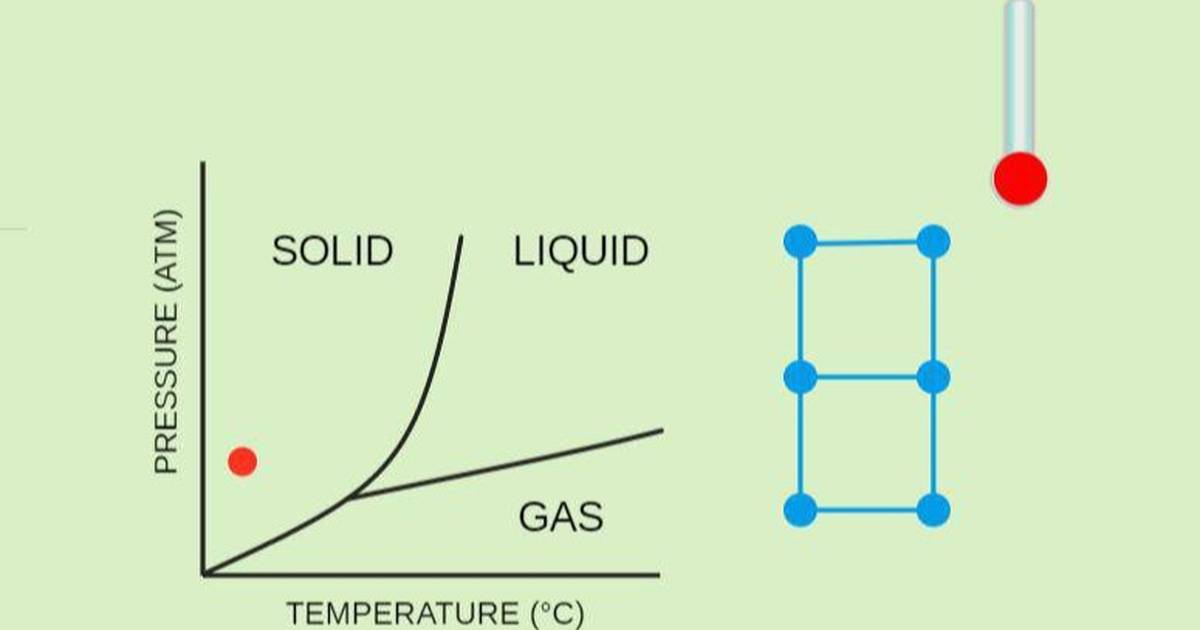
As temperature increases, the bonds between molecules can become unstable and break. We use phase diagrams to understand and predict the behavior of a material under certain conditions. This interactive activity, aimed at grades 10, 11, and 12, explores temperature changes and has questions that check for understanding of the concepts.
Topics
- phases of matter
- properties of matter
- solid
- liquid
- gas
- temperature