Data Visualization
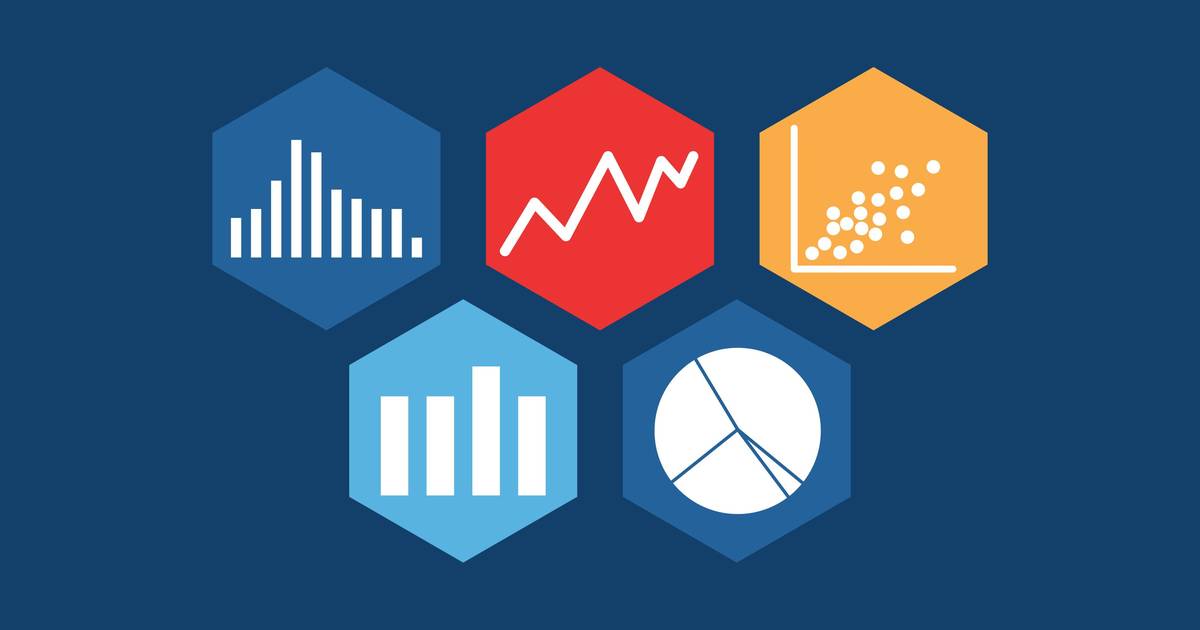
This is the summative question set for the Data Visualization pathway in the Data Science in Biotechnology cluster. The question set is intended to test key concepts from the pathway, including axis titles and scales, bar graphs, line graphs, histograms, scatter plots, and choosing the best data visualization.
Topics
- data science
- data literacy
- high school
- next generation science standards
- NGSS
- pH
- axis titles
- axis intervals
- axis scales
- histogram
- bar graph
- line graph
- scatter plot
- interpolation
- eye color